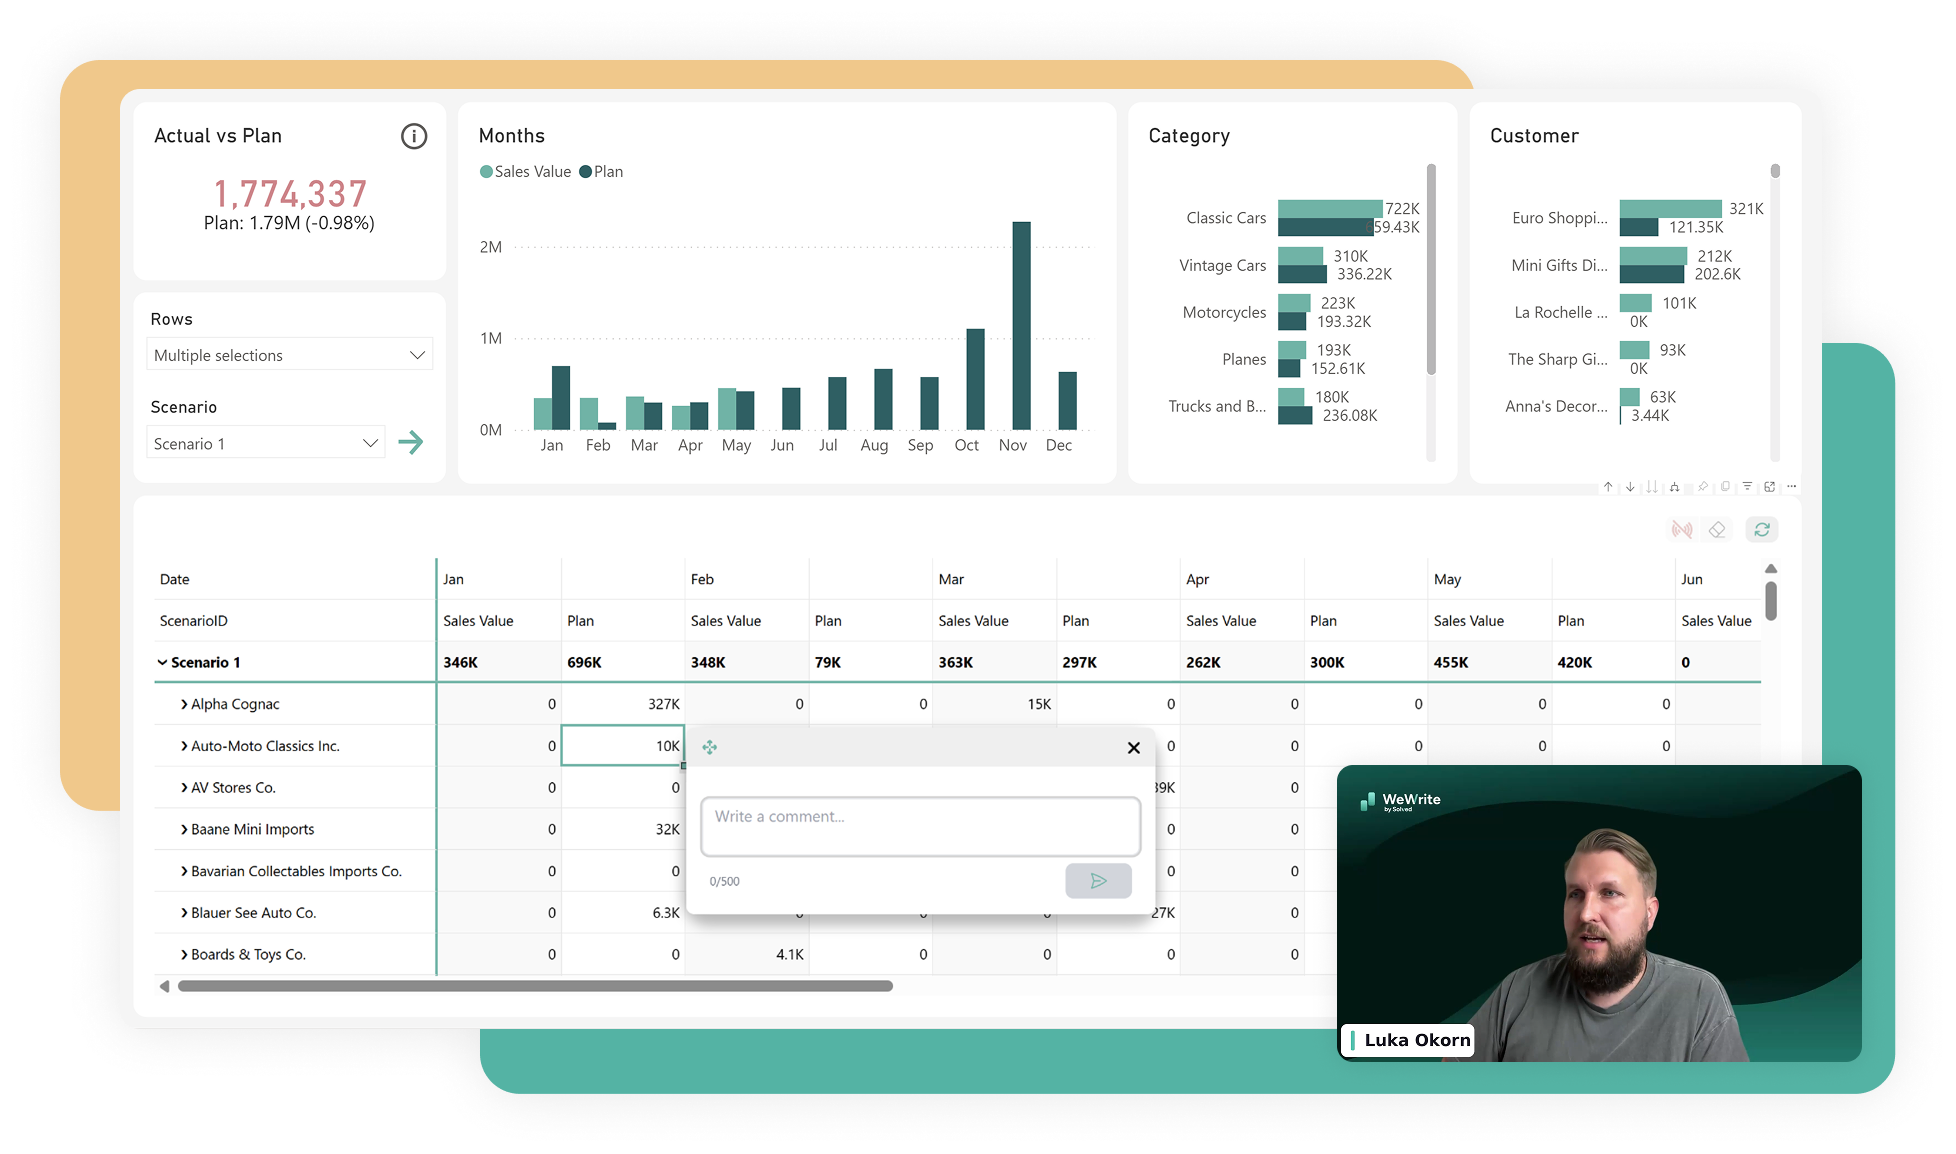
If you work in FP&A or financial controlling, you know the drill all too well.
You build beautiful, automated dashboards in Power BI to track your Actuals. But the second it’s time for budgeting, forecasting, or planning, the automation stops. You export the data to Excel, send multiple versions out to department managers, track down overwrites, and spend days manually consolidating _v2_final_FINAL.xlsx files back into your database.
In our recent webinar, we showed a better way: doing your planning and writeback directly inside Power BI using the WeWrite custom visual. Here is a quick overview:
Revenue Planning Table
Supported Input Types
Revenue Planning Use Case
Multi-User Example
Architecture Overview
Security & Governance
Building a Simple P&L Case
Watch the Step-by-Step Build
This blog post only scratches the surface. In the full 35-minute session, we went from a blank slate to afully functioning, secure P&L planning model, including a live Q&A covering architecture, TLS 1.2 security, and client-hosting options.
What we’ve learned:
Revenue Planning Table We kicked off the demo with a live revenue planning table to show the core writeback loop in action: changing a value directly inside the visual, hitting save to trigger the instant writeback, and refreshing the visual to see the persistent data securely updated in the database.
Supported Input Types Financial planning requires more than just numbers, so we demonstrated the diverse input types WeWrite natively supports within a standard matrix layout, including text entries, dates, custom dropdown selectors, and status checkmarks.
Revenue Planning Use Case We dove deeper into a live revenue workflow to showcase advanced flexibility: editing values, jumping between different scenarios, adding row-level comments, using weighted or equal distribution methods, applying local filtering, and seamlessly managing dynamic hierarchy changes using Power BI field parameters.
Multi-User Example To simulate a real-world corporate environment, we showed true live collaboration by jumping between a Planner view and a high-level CRO/Manager view, showing multiple users updating data simultaneously with instant review and audit tracking.
Architecture Overview We mapped out the robust technical blueprint of the solution, which consists of the native Power BI visual frontend, an optional API layer, and a secure database backend—fully explaining how client-hosted deployments are possible for complete infrastructure control.
Security & Governance Data integrity is paramount, so we reviewed the enterprise-grade security protocols protecting your plans, including TLS 1.2 encryption, native Row-Level Security (RLS) integration, end-to-end frontend/backend security, and automated cell locking and conflict handling to prevent accidental overwrites.
Building a Simple P&L Case We tied it all together by building a practical Profit & Loss case from scratch: starting with existing Actuals, layering in projected COGS and operating costs directly into the visual, and watching the final EBITDA calculations update in real-time upon saving.